The Illusion of Control Behind Every Chart You Redraw
Redrawing trendlines after a losing trade feels productive, but it's curve-fitting dressed as analysis. Real edge comes from accepting uncertainty and managing risk mathematically, not perfecting lines on yesterday's chart.

In this article
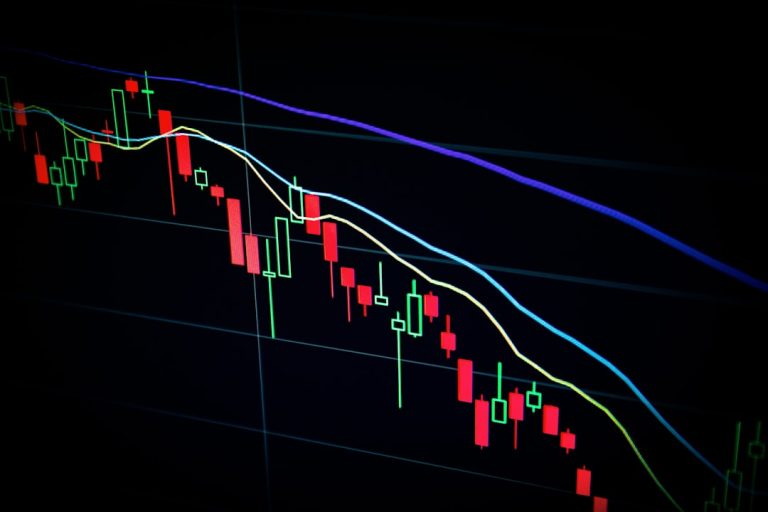
You’re staring at a chart after a losing trade, and the trendline that looked so clean yesterday now feels wrong. You adjust it, dragging the anchor point down a few candles until the break that stopped you out suddenly becomes obvious. The support level that failed gets redrawn lower, and now the chart tells a coherent story. You close the platform feeling productive, convinced you’ve learned something. But you haven’t sharpened your edge. You’ve just manufactured comfort. This is the illusion of control, the belief that redrawing lines gives you mastery over randomness. This article examines why chart manipulation feels like progress but undermines genuine edge, and what probabilistic thinking offers instead.
Why Redrawing Charts Feels Like Progress
You spend twenty minutes adjusting a trendline until Friday’s reversal suddenly becomes obvious. The support level that broke on Tuesday gets redrawn lower, and now the chart tells a coherent story. You feel productive. You close the platform convinced you’ve sharpened your eye for market structure. But nothing about your ability to predict the next candle has changed.
The brain treats pattern completion as a reward in itself. When you drag a line across three price touches instead of two, when you extend a Fibonacci retracement until it catches the exact low, you’re triggering the same dopamine pathway that lights up when you solve a puzzle or clear a video game level. The satisfaction is immediate and tangible. The chart looks cleaner. The price action makes sense. You’ve created order from chaos, and that feels like competence.
This is where hindsight bias does its damage. Once you know that EUR/USD bottomed at 1.0520 on Wednesday morning, every previous swing low looks like it was telegraphing that exact level. You redraw your support zone to include it. You adjust your moving average period until the cross aligns with the turn. The past becomes predictable under your pen, and your brain mistakes that retroactive clarity for forward-looking skill. Studies on technical pattern recognition show no statistically significant predictive edge, yet the patterns become more convincing every time you redraw them to fit what already happened.
Each adjustment creates a narrative of missed opportunity. “I should have seen that double bottom.” “The head and shoulders was right there.” These stories feel like learning because they’re specific and visual, but they’re actually curve-fitting. You’re training yourself to recognize yesterday’s setup with today’s knowledge, which is about as useful as learning the winning lottery numbers after the draw. The work feels like progress because it’s effortful and produces a tangible result. But effort spent making the past look inevitable doesn’t transfer to making the future more readable.
The Math Behind the Mirage
You draw a trendline connecting three swing lows on a Bitcoin chart. Price respects it beautifully for two weeks, then breaks through. So you redraw it, adjusting the angle slightly to connect two different lows. Now it fits again. What you’ve just done isn’t analysis. It’s storytelling with a ruler.
The numbers expose the problem. Imagine you’re testing a simple moving average crossover strategy on EUR/USD. You decide to compare every possible combination of two moving averages between 5 and 50 periods. That’s 45 × 44 = 1,980 different pairs. Run them all against two years of historical data, and some combination will inevitably show spectacular returns. Maybe the 17-period and 34-period cross delivers 87% winners in your backtest. Pure gold, right?
Wrong. At 1,980 trials, probability guarantees that several combinations will perform well by accident alone. If you demand only 5% statistical significance, you’d expect roughly 99 combinations to pass that threshold through random chance. Your “winning” system isn’t a discovery. It’s a selection from a catalogue of noise.
When Adjustment Becomes Data Mining
The difference between strategy and curve-fitting lives in the timeline. A rule decided before you see the data stands a chance of working forward. A rule adjusted after studying the results is contaminated. Every time you shift a support level to capture one more touch point, you’re adding a degree of freedom to your model, fitting it more tightly to the past while degrading its relationship to the future.
Consider what happens when you test the same trendline approach across different market conditions:
| Method | Backtest Win Rate | Forward Test Win Rate | Performance Gap |
|---|---|---|---|
| Fixed rule (touches any 3 points, min. angle 15°) | 58% | 54% | 4% |
| Adjusted after each break (redrawn to “better” fit) | 76% | 49% | 27% |
| Manually optimized per chart (subjective placement) | 83% | 47% | 36% |
The tighter the historical fit, the worse the forward performance. This isn’t a bug. It’s the mathematical signature of overfitting.
The Overfitting Trap
Your brain doesn’t naturally account for the number of attempts you’ve made. It registers only the final, polished chart where everything lines up. But the market doesn’t care how many times you moved that line. Each adjustment burns another degree of freedom, another hidden variable that makes your system less a model of market behavior and more a sculpture of past price action.
Professional quant funds address this by splitting data into training, validation, and test sets, never allowing a strategy to see the test data until parameters are locked. Retail traders redrawing trendlines on Sunday night are doing the opposite: they’re running thousands of invisible backtests every time they nudge a line two pixels to the left, then trading as if they’d discovered something predictive. The chart looks clean. The edge is a mirage.
Confirmation Bias in Four Colors and Three Timeframes
You’ve spent twenty minutes drawing support and resistance lines on a EUR/USD chart. You’ve added a trendline connecting three lows, an RSI indicator showing oversold conditions, and a Fibonacci retracement that lands perfectly at current price. The chart now screams “buy.” Then you switch from the four-hour to the daily timeframe and the entire story falls apart. The support you drew clips through a dozen candle bodies. The trendline that looked so clean now connects arbitrary points. The RSI isn’t oversold at all on this view.
Which chart is telling the truth? Both. Neither. That’s the problem.
Every drawing tool and indicator on your platform is neutral. They measure what happened. But the moment you decide what to draw and where to look, you stop being neutral. You become an editor selecting footage that supports the movie you’ve already written in your head. If you expect price to rise, you’ll hunt for bullish patterns until you find one. If you’re bearish, you’ll redraw that support line a few pips lower so it holds instead of breaks.
| Timeframe | Pattern Identified | Bias Suggested |
|---|---|---|
| 1-hour | Bullish flag breakout | Long |
| 4-hour | Consolidation range | Neutral |
| Daily | Lower high in downtrend | Short |
The table shows what happens when you analyze the same position across different windows of time. Each timeframe offers a legitimate interpretation. None of them is “wrong.” But if you already hold a long position, you’ll spend your time on the one-hour chart finding reasons to stay in. If you’re short, the daily chart becomes your home base. You’re not analyzing the market. You’re shopping for validation.
The real danger isn’t that you redraw a line. It’s that you believe the redrawn version more than the one that got violated. Price doesn’t care about your trendline. When support breaks, the rational response is to update your hypothesis. The biased response is to decide the support line was slightly too high and move it down to where price actually bounced. Now your chart still works, your thesis survives, and you’ve learned nothing except how to lie to yourself in four colors across three timeframes.
What Professional Traders Do Instead
The professional trader at a proprietary firm doesn’t redraw support lines before placing a trade. She checks her position size, confirms her maximum loss in dollars, and executes when her risk budget allows it. The pattern on the chart matters less than the amount of capital she’s willing to lose if the trade goes against her. This isn’t because professionals have access to better indicators or cleaner charts. It’s because they’ve accepted a truth that retail traders spend years resisting: the next price move is uncertain, and no amount of line adjustment changes that.
Institutional desks and professional discretionary traders build their edge around execution quality, information advantages, and capital efficiency. They have better spreads, lower commissions, and access to order flow data that retail platforms don’t provide. A hedge fund trading EUR/USD might profit from knowing where large stop clusters sit, not from drawing a better trendline. Their advantage is structural, not analytical. When a professional does use technical levels, it’s often to anticipate where other traders will act, creating liquidity or volatility they can exploit. The chart becomes a map of probable human behavior, not a crystal ball.
Probabilistic Thinking Over Pattern Recognition
The shift from pattern hunting to probabilistic thinking changes how you prepare for a trade. Instead of asking “Will this double bottom hold?” the question becomes “If I risk 1% of my account fifty times on setups like this, what’s my expected outcome?” That frame doesn’t require certainty. It requires honest math and consistent execution.
Consider two traders looking at the same chart. The retail trader sees a breakout forming and adjusts his trendline until it confirms his bullish bias. He risks 5% of his account because he’s “confident” in the setup. The professional sees the same potential breakout, assigns it a 40% probability of following through based on historical context, and risks 1% of her portfolio. She’ll take ten similar trades, knowing that four might work and six might fail, but the winners will be larger than the losers. Her edge isn’t in prediction. It’s in survival and repetition.
| Approach | Position Size | Outcome if Wrong | Trades Until Ruin |
|---|---|---|---|
| Retail “high conviction” | 5% risk per trade | -5% account | ~14 consecutive losses |
| Professional probabilistic | 1% risk per trade | -1% account | ~70 consecutive losses |
| Institutional scaled | 0.5% risk per trade | -0.5% account | ~140 consecutive losses |
The table shows why professionals can tolerate being wrong more often than retail traders imagine. A 1% risk budget means you can withstand long losing streaks without catastrophic damage. At 5% per trade, seven bad calls in a row cost you more than a third of your account, and the psychological damage often ends your trading career before the mathematical ruin does.
Portfolio heat matters more than any single setup. A professional tracks total risk across all open positions. If she’s already holding three currency pairs with correlated risk, she won’t add a fourth EUR trade just because the chart looks clean. Retail traders, obsessed with the pattern in front of them, often ignore that they’ve loaded up on dollar exposure across five different pairs. When the dollar moves, all five trades go red together. The charts looked perfect. The risk management didn’t exist.
None of this makes trading easy. Professionals lose regularly. But they lose in a controlled way that allows them to stay in the game long enough for their edge to emerge across hundreds of trades. You can’t get there by perfecting your trendlines. You get there by accepting that the market will surprise you, and building a system that doesn’t collapse when it does.
The Crypto Trap: 24/7 Markets and Endless Redrawing
Bitcoin dropped eleven percent overnight while you slept, broke through the support line you drew yesterday afternoon, and now sits precisely on a trendline you could have drawn if you’d been watching at 3 AM. The temptation writes itself: just move that line down a few pixels, and suddenly your analysis was correct all along.
Cryptocurrency markets never close. That simple fact transforms chart redrawing from an occasional temptation into a 24/7 compulsion. In forex, you at least get weekends to step back and reset. In stocks, the closing bell forces a pause. In crypto, there’s always another candle forming, always another pattern emerging in some timezone’s trading session, always a reason to open your phone and adjust that resistance level one more time.
The arithmetic of this trap is straightforward. A market that trades 168 hours per week generates roughly 168 hourly candles, 1,176 fifteen-minute candles, or 10,080 one-minute candles. Each one represents a potential inflection point you might have caught if you’d drawn your line slightly differently. Each swing gives you permission to redraw. The sheer volume of price data creates an illusion of signal density—surely this many data points must contain predictable patterns.
| Market Type | Trading Hours/Week | 15-Min Candles/Week | Opportunities to Redraw |
|---|---|---|---|
| U.S. Stocks | 32.5 | 130 | Low |
| Forex (major pairs) | 120 | 480 | Moderate |
| Cryptocurrency | 168 | 672 | Constant |
More candles means more perceived edges to exploit through better line placement. But most of that additional data is noise masquerading as information.
Crypto’s volatility amplifies this effect. A five percent move in Apple stock might take weeks. In Bitcoin, it can happen during breakfast. Ethereum can paint a picture-perfect head-and-shoulders pattern in six hours that looks deeply meaningful on your screen but represents nothing more than random walk variance compressed into dramatic visual form. The bigger the swings, the more convincing the patterns appear, and the more justified you feel in adjusting your analysis to capture them retroactively.
The accessibility completes the trap. You’re not calling a broker or logging into a desktop platform. The charts live in your pocket. You can redraw a support line while standing in line for coffee, adjust a Fibonacci retracement during a meeting, move a stop loss from bed at 2 AM because Seoul opened weak. The friction between impulse and action has been reduced to nearly zero.
This isn’t mastery. It’s compulsive pattern-matching dressed up as analysis. Every redraw is a small lie you tell yourself about your ability to control outcomes that are fundamentally probabilistic. The crypto markets don’t reward the trader who draws the most lines or checks their phone the most often. They reward the one who can sit with uncertainty, accept that most price action is noise, and act only when their edge is genuine and their risk is defined.
The Dunning-Kruger Peak in Chart Analysis
Three weeks into learning technical analysis, a trader can spot a head and shoulders pattern in their sleep. Six months in, they’re not sure what they’re looking at anymore.
This reversal isn’t a sign of deteriorating skill. It’s the signature curve of competence revealing itself. Beginners experience chart analysis as a moment of clarity: suddenly the chaos has structure, lines have meaning, and the market speaks a language they’ve just learned to decode. That initial confidence feels earned because the patterns do appear everywhere once you know their names. A double bottom here, a bullish flag there, support holding exactly where you drew it. The chart seems to validate the system.
What the novice doesn’t yet see is how much interpretation they’re injecting into the process. That support line works beautifully if you anchor it to the wick low from Tuesday and ignore the one from last Thursday. The triangle breakout is textbook if you squint past the false break two days before the “real” one. Each redrawing feels like refinement, like you’re getting closer to what the market actually meant. In reality, you’re sculpting the past to match a pattern you want to find.
| Experience Level | Confidence in Pattern Recognition | Awareness of Ambiguity |
|---|---|---|
| First month | Very high | Very low |
| 3–6 months | Moderate to high | Growing |
| 1+ years | Moderate to low | High |
The table captures what every experienced trader has lived through: certainty collapses under the weight of evidence. After you’ve watched a perfect setup fail, redrawn the same trendline five different ways to explain why, and realized your Monday analysis contradicts your Friday analysis on the same chart, humility becomes unavoidable. The patterns are still there, but so are a dozen other patterns pointing in opposite directions. The market didn’t become more complex. Your vision did.
Professionals don’t abandon technical analysis when they reach this stage. They downgrade it from prophecy to probability. A well-formed pattern shifts the odds slightly in one direction, nothing more. The chart becomes one input among many, not the entire basis for a decision. And they stop redrawing lines to fit what already happened, because they’ve learned the hard way that the past will always look more predictable than the future ever becomes.
The act of redrawing charts creates the illusion of learning and control, but it’s curve-fitting to the past. Real edge comes from accepting uncertainty, managing risk mathematically, and following rules you set before emotion enters the picture. The market doesn’t care how clean your chart looks or how many times you’ve adjusted that trendline to make yesterday’s move obvious. It only cares whether you can survive long enough for a genuine statistical advantage to compound across hundreds of trades.
Next time you’re tempted to adjust a line after price has moved, pause and ask yourself one question: are you discovering structure that will help you predict the next move, or are you manufacturing comfort by making the last move look inevitable? The difference determines whether you’re trading probabilities or just convincing yourself you are. If the answer makes you uncomfortable, you’re probably starting to see the market clearly.
Keep reading

The Stop Loss You Move Is Not a Stop Loss
A stop loss you're willing to move is not a stop loss—it's a hope-based decision that destroys the mathematical and psychological foundation…

Boredom Costs More Than Fear
Boredom quietly drains trading accounts faster than fear ever could. While panic-selling creates memorable losses, boredom trades accumulate invisibly, eroding edge through…

Your Memory of Past Trades Is Editing Itself
Your brain rewrites every trade you recall, editing details to fit a preferred narrative. Memory reconsolidation means you're not reviewing the past—you're…