Drawdown Math Is Crueler Than It Looks
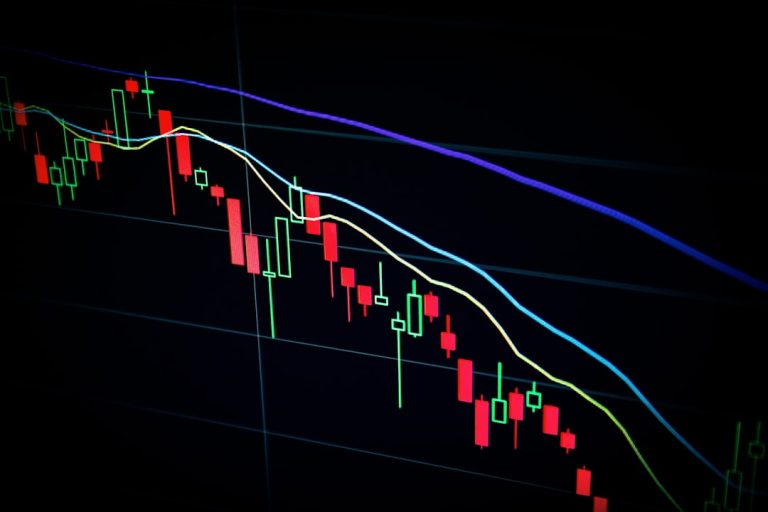
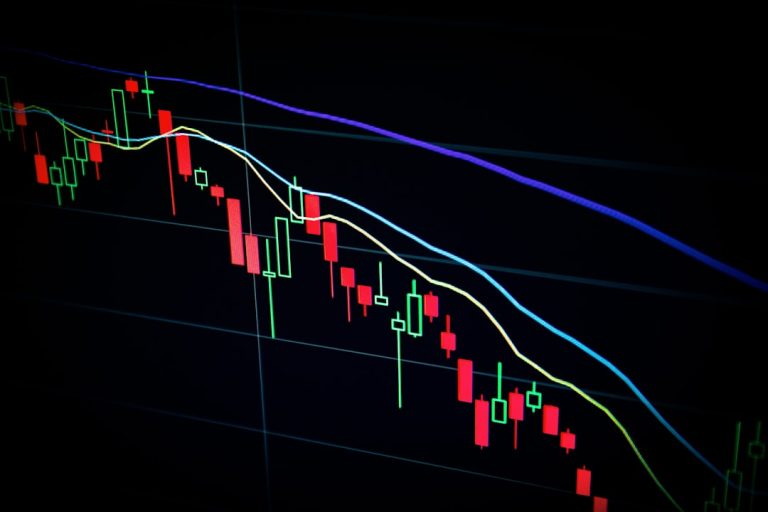
A 50% loss doesn't need a 50% gain to recover. It needs 100%. This mathematical asymmetry destroys more trading accounts than bad entries ever will.
In this article
You’re watching your $10,000 account drop to $5,000, and the mental math feels simple: you need to make back 50% to recover. That calculation is wrong, and the error costs traders their careers. The truth is harder. You need a 100% gain to break even, because that $5,000 recovery represents a 100% return on your remaining capital. This isn’t a trick of language or a psychological quirk. It’s asymmetric mathematics, and it works against you every time you take a loss. Understanding why drawdown math matters more than win rates, why professionals obsess over it, and how these numbers should reshape your approach to position sizing and risk management is what separates traders who survive long enough to compound gains from those who blow up chasing recovery.
The Asymmetry That Catches Everyone
You lose half your account and think, “Well, I need to make back 50% to break even.” That calculation feels intuitive. It’s also completely wrong.
The truth is harder. If you start with $10,000 and lose 50%, you’re left with $5,000. Now you need to make $5,000 to get back to where you started. But that $5,000 gain represents a 100% return on your remaining $5,000 capital base. You don’t need to make back the same percentage you lost. You need to make back double.
This isn’t a trick of psychology or a metaphor about the pain of losing. It’s arithmetic. The asymmetry exists because percentages are always calculated relative to your current capital, and after a loss, that number has shrunk. A 50% loss and a 50% gain don’t cancel each other out. They leave you with 75% of what you started with.
| Drawdown | Remaining Capital | Gain Required to Recover |
|---|---|---|
| 10% | 90% | 11% |
| 25% | 75% | 33% |
| 50% | 50% | 100% |
| 75% | 25% | 300% |
| 90% | 10% | 900% |
Notice how the gap widens. A 25% drawdown requires a 33% gain to recover, which is challenging but manageable over time. But once you cross 50%, the math becomes vicious. A 75% loss demands a 300% return. That’s not a few good months. That’s a career-defining win streak most traders will never see.
Bitcoin’s fall from $19,783 in December 2017 to $3,200 a year later was an 83% drawdown. Anyone who held through it needed a 488% gain just to break even. It eventually happened, but it took years and required the kind of conviction that looks obvious in hindsight and reckless in the moment.
The lesson isn’t that drawdowns are emotionally painful, though they are. The lesson is that they’re mathematically expensive. Every percentage point you lose costs you more than the equivalent percentage point gained. This asymmetry is why professional traders often stop trading entirely after a 20% to 25% drawdown. Not because they’ve lost faith, but because the math of recovery starts working against them. Better to preserve capital and reset than to dig a hole so deep that even a winning strategy can’t climb out in a reasonable timeframe.
Why Professional Traders Draw the Line at 20-25%
Most professional traders will halt trading or completely rework their approach after a 20-25% drawdown. This isn’t superstition or arbitrary caution. It’s recognition that beyond this threshold, the mathematics of recovery shift from difficult to nearly impossible within any reasonable timeframe.
The Recovery Time Problem
The asymmetry of drawdowns creates a time trap that kills trading careers. A 20% loss requires a 25% gain just to break even. Annoying, but manageable. A 30% loss demands 43% back. A 50% drawdown needs 100%. These aren’t just bigger numbers—they represent exponentially longer recovery periods because you’re now trying to generate those returns on a diminished capital base.
Consider how this plays out in real time. If your strategy generates 15% annually on average (a respectable return), recovering from a 20% drawdown takes roughly 16 months of perfect execution with no further losses. A 30% drawdown extends that to nearly two years. At 50%, you’re looking at close to five years of flawless trading to get back to where you started. Most traders don’t have five years of psychological resilience to deploy on a comeback story.
| Drawdown | Gain Required | Recovery Time |
|---|---|---|
| 20% | 25% | ~16 months |
| 30% | 43% | ~24 months |
| 50% | 100% | ~58 months |
| 60% | 150% | ~90 months |
The table assumes consistent returns with no compounding losses, which makes it optimistic. In practice, traders deep in drawdown rarely execute with the discipline required for steady recovery.
When the Math Becomes Impossible
Hedge funds and institutional desks typically operate within a 15-30% maximum drawdown envelope. Renaissance Technologies, arguably the most successful quantitative fund in history, has experienced drawdowns in the mid-teens. When a professional fund hits 20-25%, investors start withdrawing capital and managers start questioning their models. At 30%, heads roll.
Retail traders routinely blow past 50% and keep trading, convinced the next trade will turn it around. It almost never does. The psychological damage of watching your account cut in half changes how you trade. You either become reckless, chasing recovery through oversized positions, or paralyzed, unable to take valid setups because every loss now feels catastrophic. Neither state produces good decisions.
The 20-25% threshold isn’t about protecting your feelings. It’s about preserving enough capital and mental clarity to actually implement a recovery strategy. Below this line, you still have optionality. Above it, you’re playing a different game entirely—one where the odds have turned genuinely brutal and time is no longer on your side.
Consecutive Losses Multiply the Damage
Most traders mentally add up their losses. Five 10% losses feel like they should equal a 50% drawdown. The actual math is worse, because each loss eats into an already-reduced capital base.
If you start with $10,000 and lose 10%, you’re at $9,000. Lose another 10%, and you don’t drop to $8,000. You drop to $8,100, because that second 10% is calculated on the smaller amount. By the time you’ve taken five consecutive 10% losses, you’re not down 50%. You’re sitting at $5,905, a 41% drawdown. Ten consecutive 5% losses don’t halve your account. They leave you with approximately $5,987, roughly a 40% drawdown instead of the 50% your instincts suggest.
| Number of Losses | Loss Per Trade | Intuitive Total (Additive) | Actual Drawdown |
|---|---|---|---|
| 5 | 10% | 50% | 41% |
| 10 | 5% | 50% | 40% |
| 8 | 7% | 56% | 48% |
The table shows that even modest individual losses create substantial drawdowns when they cluster. This clustering happens far more often than randomness alone would predict, even in profitable systems. A strategy with 55% win rate and proper risk management can still face stretches where eight or ten losers arrive in tight succession. Monte Carlo simulations of positive-expectancy systems routinely generate 30% to 40% drawdowns during otherwise normal operation, not because the system failed but because probability distributions have tails.
This is why professional risk managers plan for consecutive losses rather than average them away. Your edge doesn’t protect you from variance. It only ensures that over enough trials, the wins will outpace the compounded losses. Between here and there, the multiplication does its damage.
Position Sizing Is Your Only Real Defense
You can spend years optimizing entries, refining indicators, and hunting for edge in market structure. But if you risk 10% per trade, none of it matters. Position sizing is the single variable that determines whether a string of losses becomes a temporary setback or a career-ending crater. It’s not the most exciting lever to pull, but it’s the only one that directly controls how deep you fall when things go wrong.
The 1-2% Rule Explained
The Kelly Criterion, a formula originally developed for gambling, suggests optimal position sizing based on your win rate and average win-to-loss ratio. For most retail traders with realistic edge, the math lands you at risking 1-2% of your account per trade. Not 1-2% of your margin. Not your position size. The actual amount you stand to lose if your stop is hit.
This feels painfully small when you start. It feels like you’re wasting opportunities. But the alternative is mathematical suicide. Risk 10% per trade and you’re four consecutive losses away from a 34% drawdown. That requires a 52% gain just to break even. Risk 2% and those same four losses cost you 7.8%. You recover that in two decent wins.
Why Halving Risk Doesn’t Halve Returns
Here’s the asymmetry that saves careers: cutting your position size in half doesn’t cut your long-term returns in half. It cuts your maximum drawdown by 40-50% while only marginally reducing compounded gains. The reason is that smaller positions keep you in the game longer. You survive the inevitable losing streaks that knock out traders who size aggressively.
| Risk per Trade | Loss After 5 Consecutive Losses | Gain Required to Recover |
|---|---|---|
| 10% | 41% | 69% |
| 5% | 23% | 30% |
| 2% | 9.6% | 10.6% |
| 1% | 4.9% | 5.1% |
Look at what happens when you drop from 5% to 2% risk. Your drawdown after five losses shrinks from 23% to under 10%. The recovery effort becomes trivial instead of demoralizing. You don’t need a miracle trade. You just need your system to start working again.
Professional traders don’t stop out at 20-25% drawdowns because they’re cowards. They stop because the math beyond that point becomes vicious. A 30% hole needs a 43% gain. A 40% hole needs 67%. A 50% hole needs 100%. Once you’re down by half, you’re climbing with a reduced stake and the psychological weight of knowing you need to double what’s left just to see your starting balance again. Risk of ruin doesn’t increase linearly as you size up. It accelerates. Every percentage point you add to position size dramatically increases the probability that a normal losing streak ends your account.
The game isn’t about hitting home runs. It’s about staying at the table long enough for your edge to express itself across hundreds of trades. Position sizing is how you buy that time.
Crypto Makes the Math Even More Brutal
Bitcoin dropped 83% from its December 2017 peak of $19,783 to roughly $3,200 thirteen months later. That wasn’t a black swan. It was Tuesday in crypto.
The same drawdown arithmetic that punishes traditional traders applies to cryptocurrency markets, except the numbers arrive faster and cut deeper. An 83% loss requires a 488% gain just to break even. If you held through that decline with poor position sizing, your $10,000 became $1,700, and you’d need to nearly quintuple that remainder to see your original capital again. Most traders never make it back.
| Drawdown | Capital Remaining | Gain Required to Recover |
|---|---|---|
| 50% | $5,000 | 100% |
| 70% | $3,000 | 233% |
| 83% | $1,700 | 488% |
| 90% | $1,000 | 900% |
What makes crypto particularly dangerous is that these drawdowns happen even during bull markets. Altcoins routinely fall 80-90% from local peaks before the broader market trend reverses. You can be right about the four-year cycle, right about adoption trends, and still get wiped out because your position size assumed stability that never existed.
The lesson isn’t to avoid crypto. It’s to respect that volatility demands smaller position sizes than you think you need. When a 50% drawdown can arrive in a weekend rather than a quarter, the math doesn’t just punish overconfidence. It ends careers.
Time Underwater Breaks More Traders Than Depth
You can survive a 35% drawdown. What breaks you is watching that red number sit there for eleven months.
A trader with a sound strategy might endure a sharp, sudden loss. The numbers sting, but the path forward remains clear: stick to the plan, wait for the edge to reassert itself, compound back to breakeven and beyond. But when weeks turn into months and the equity curve refuses to climb, doubt replaces discipline. The internal monologue shifts from “my system works” to “maybe I’m the problem.” That’s when profitable strategies get abandoned three months before they would have recovered.
| Drawdown Depth | Time Underwater | Trader Response |
|---|---|---|
| 40% | 6 weeks | Uncomfortable but manageable |
| 25% | 9 months | Severe doubt, strategy questioned |
| 18% | 14 months | High abandonment rate despite shallow loss |
The table shows what experienced traders already know: psychology has a half-life. Even modest drawdowns become intolerable when they refuse to end. Bitcoin’s 83% collapse from late 2017 to December 2018 destroyed accounts, but the thirteen-month duration destroyed resolve. Many who survived the crash still sold near the bottom, not because they couldn’t afford the loss, but because they couldn’t afford the uncertainty.
This is why metrics like the Calmar ratio matter. It divides annualized return by maximum drawdown, rewarding systems that deliver gains without forcing you to white-knuckle through endless red months. A strategy returning 30% per year with a 15% max drawdown scores better than one returning 50% with a 40% max drawdown, because you’re far more likely to actually stay in the former. The game isn’t just beating the market. It’s building something you can live with long enough to let the probabilities work.
What You Can Actually Do About It
Most traders set their risk limits the same way amateur poker players set their table stakes: they decide how much they’re willing to lose after they’ve already sat down. That’s backwards. The time to decide your maximum acceptable drawdown is before you risk a single dollar, when your judgment isn’t clouded by open positions or recent losses.
Start by choosing a hard maximum drawdown threshold and treating it as non-negotiable. Professional traders typically stop at 20-25% because the math beyond that point turns vicious. If you lose 30% of your account, you need a 43% gain just to break even. Hit 40% down and you’re chasing a 67% recovery. These aren’t just numbers. They represent months or years of perfect trading to undo weeks of mistakes.
Your position sizing should work backward from this limit. If your maximum acceptable drawdown is 20% and you want to survive at least ten consecutive losses before hitting that threshold, you can’t risk more than 2% per trade. Use a position sizing calculator, not your gut. The calculator doesn’t get optimistic after three wins or desperate after two losses.
Track maximum drawdown as a primary performance metric, right alongside win rate and profit factor. A strategy that returned 60% last year but experienced a 55% drawdown is a trap, not a triumph. You probably would have abandoned it at 40% down, which means the theoretical return is irrelevant. A system that delivers 30% annually with a maximum 18% drawdown is actually tradeable. You can stick with it through the rough patches because the rough patches don’t feel like extinction events.
When you evaluate a new strategy, ask what it costs in drawdown, not just what it promises in returns. The best strategy is the one you can actually execute when it’s losing, because every strategy loses sometimes. If the drawdown exceeds your psychological pain threshold, you’ll break your own rules exactly when following them matters most.
Drawdown math isn’t designed to scare you away from trading. It’s a game mechanic, like the rake in poker or the house edge in blackjack. You can’t eliminate it, but you can design your entire approach around it. The asymmetry is permanent. A 50% loss will always demand a 100% gain to recover. But that reality stops being a threat the moment you accept it and build your position sizing accordingly. The traders who survive aren’t the ones with the highest win rates or the best entries. They’re the ones who respected the math enough to stay small, preserve capital through the inevitable losing streaks, and remain in the game long enough for their edge to compound. Protect the downside first. Everything else follows from that.
Keep reading

Correlation Turns Five Positions Into One
Five positions across different currency pairs feel like diversification until the dollar moves and all five collapse together. Correlation turns what looks…

Why Risking Two Percent Is Not Automatically Safe
A trader follows the 2% rule religiously but still loses 25% in three weeks. The problem isn't rule-breaking—it's misunderstanding what the rule…
Your Position Doesn’t Sleep When You Do
Your forex or crypto position doesn't sleep when you do. It remains live and exposed to global markets operating in shifts you'll…